In today’s data-driven world, having the right KPIs at your fingertips matters, and this also applies to payment data. You need meaningful information to provide a clearer picture and inform strategic decisions. On the other hand, too little information means flying blind; and too much information is just noise that obscures relevant details. Identifying what information is needed for a particular role is the first step. The next step is visualizing this information to bring relevant details into sharp focus, making the information easy to act upon.
Bringing KPIs into Focus
As technology has become more powerful and data storage costs have fallen, analyzing large datasets is no longer the challenge it once was. This has led to a glut of data being collected by businesses around the world, in the hope of gleaning business insights. But insights are not won from collecting data, but from meaningfully visualizing relevant data. No business wants to be flying blind, making strategic decisions on gut instinct alone, but going too far in the opposite direction risks obscuring insightful data with noise. Up to 80% of data collected by businesses is thought to be unstructured, making it confusing and time-consuming to work with. Presenting this data in a well-structured form is the real challenge. Like with any good picture, the viewer’s focus should immediately be drawn to what really matters.
This challenge is further complicated, because what data is relevant depends on context. A risk manager analyzing transaction data might be interested in visualizing chargebacks and fraud rates. A sales manager will be more interested in understanding what payment methods are most popular, or in identifying peak transaction times. While both these use cases involve analyzing transaction data, the data needs to be presented differently to each user.

The Big Picture and Data Aggregation
As if that were not enough, merchants need to deal with a variety of data formats, with each PSP delivering transaction data with different levels of granularity and in different formats. While most PSPs offer their own analysis tools, they only provide insights into the transactions processed via that particular PSP. In contrast, IXOPAY consolidates and unifies transaction data from all PSPs in use by a merchant. Merchants can easily analyze all transactions across all their PSPs from within the payment orchestration platform. The PSP’s response including error details is stored for each transaction, i.e. whether it was successful, is pending, or was subject to a chargeback. This allows for side-by-side comparisons of individual PSPs, providing invaluable information for optimizing the merchant’s routing strategy. Data aggregation also makes it possible to analyze channels across multiple channels, covering credit cards, e-wallets, bank transfers and any alternative payment methods the merchant offers.
This data can be visualized and broken down across all providers using:
Visual dashboards created using customizable widgets
Pivot tables that display numeric data in tabular form, with the option to automatically highlight high and low values
Reports, which can be shared with colleagues or imported into third party systems for further analysis
The Role of Data Visualization
Role-specific dashboards ensure that important KPIs are immediately visible and that information is easy to parse at a glance. This is a far better approach than defining one all-encompassing company-wide dashboard that oversaturates users with too much information, and ends up pleasing no one. For example, by focusing on recent transactions, sales managers can identify trends at a glance, such as peak transaction times, popular payment methods, or the country of origin of customers. This information can be used to adjust pricing strategies, target new markets and maximize profits by tailoring the merchant’s offerings to consumer demands.
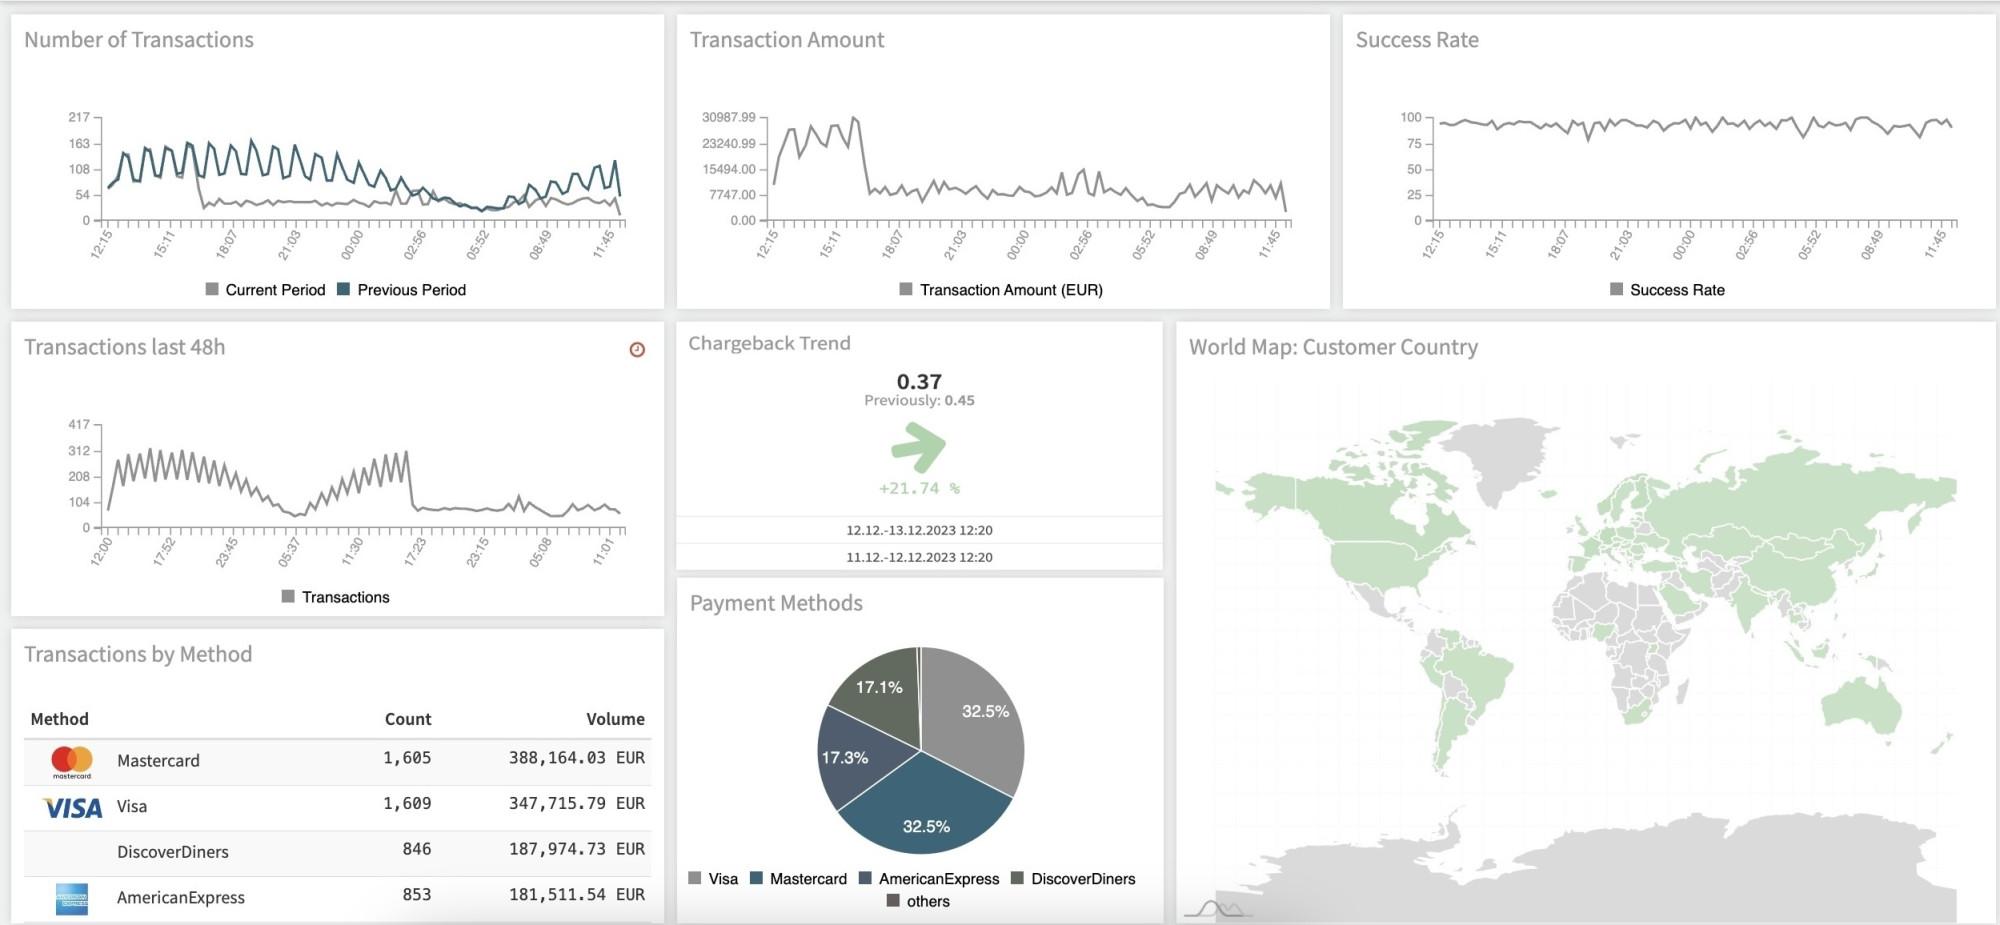
Dashboards are fully customizable, displaying any number of KPIs over a specific time period. These flexible dashboards offer a variety of widgets, each displaying different information, such as transactions by payment method, a comparison of chargeback rates for the current and preceding time period, or the total value of transactions. Each dashboard includes a global time period, which is applied to all widgets, e.g. the last 24 hours or the last 7 days. Changing this time period updates the display for all widgets using the global setting. Individual time periods can also be defined per widget, which override the global dashboard settings. Widgets can be further customized to only include a subset of data, e.g. only unsuccessful transactions broken down by status.
Dashboards can be shared with other users, or - in the case of a white label solution - merchants. Rather than each individual user defining their own dashboards and duplicating the effort, an administrator or data analyst can define templates for each user group, for example:
For executives: High level sales data, such as a world map with countries shaded according to the number of customers per country, alongside total revenue and total number of transactions over the last quarter
For sales managers: Total number of transactions over the last week, the total value of these transactions and the payment methods used
For risk managers: Chargeback rates and the status of processed transactions, in order to quickly react to a spike in the number of declined transactions that may indicate attempted fraud
A default dashboard can be defined for each user or merchant. Users can further customize these shared dashboards as well as define their own.
Pivot tables provide an interactive way to analyze large amounts of transaction data over a time period, broken down into categories. For example, a risk manager could use pivot tables to analyze chargeback and fraud data for each week, broken down by PSP and card’s country of origin. The heatmap option, which uses color codes to highlight the highest and lowest values visually, makes it easy to identify whether a particular PSP or a country is the source of a majority of chargebacks, for example. If an issue is identified, the risk manager can take remedial action, such as requiring additional authentication (e.g. 3DS) or blocking transactions from a certain IP range.
No Platform is an Island
As well as visualizing data in near realtime, transaction data can be exported from IXOPAY. These reports can either be shared with colleagues or imported into third party systems for further processing and analysis. Exported data can cover multiple PSPs, while ensuring data has the same level of granularity and consistent naming - something that cannot be achieved by exporting the data directly from the PSPs. Eliminating the need to handle multiple disparate data formats - similar to IXOPAY’s best-of-breed reconciliation and settlement handling - reduces many of the tedious overheads faced by financial teams. Reports can be used for financial forecasting and detailed financial reporting, or to fulfill regulatory requirements, such as submitting audits to regulatory authorities. Other benefits include importing historic transaction data into data analysis systems in order to analyze ROI and performance metrics or to perform predictive modeling.
IXOPAY also provides a Business Intelligence (BI) solution. Our BI Data Source API provides access to all transaction metadata without impacting on the performance of the live system, and solutions like Grafana can be used to monitor and analyze this transaction data. In fact, IXOPAY’s NOC team uses these features to monitor the status of IXOPAY around the clock in order to respond immediately to any potential issues affecting the processing of transactions.

Take Your Payment Analytics to the Next Level
By gathering payment information across PSPs, IXOPAY gives merchants the necessary toolset to paint a clearer picture and draw meaningful conclusions. The most time-consuming tasks are handled automatically, eliminating the need to juggle multiple data formats and ensuring consistent data quality. This reduces overheads and vastly simplifies the analysis of payment data across all a merchant’s channels, whether in IXOPAY itself or in specialist systems. With the canvas already prepped, presenting this data clearly and with the right focus for the right target group - executives, sales managers, risk managers and accounting staff - has never been easier for merchants and white label payment providers. If you would like to learn more about how IXOPAY can help you see the bigger picture and analyze data across all your payment providers, get in touch!