How it Works
Payment data is often scattered across PSP dashboards, acquirers, gateways, fraud tools, and internal systems. IXOPAY Payments Analytics brings that data together into one consolidated analytics environment, helping teams monitor performance, investigate issues, and make better payment decisions faster.
Use configurable dashboards, granular filters, and reporting views to analyze performance by provider, geography, issuer, BIN, payment method, currency, customer, MID, and more.
From payment data to payment decisions
Improve approvals
Spot failed payments, issuer declines, gateway issues, and retry opportunities so your team can reduce avoidable checkout failures and recover more revenue.
Protect net revenue
Track sales, refunds, fees, disputes, and chargebacks in one place to understand the real economics behind every transaction.
Control costs
Break down processing costs across interchange, scheme, acquirer, gateway, conversion, and chargeback fees to uncover margin leakage and optimization opportunities.
Act faster
Give payment, finance, risk, and operations teams shared dashboards and consistent data, without relying on manual exports from every provider.
Analyze every major payment performance driver
Increase approvals and reduce checkout revenue leakage.
Understand why transactions fail and where performance can improve across issuers, gateways, markets, and payment methods.
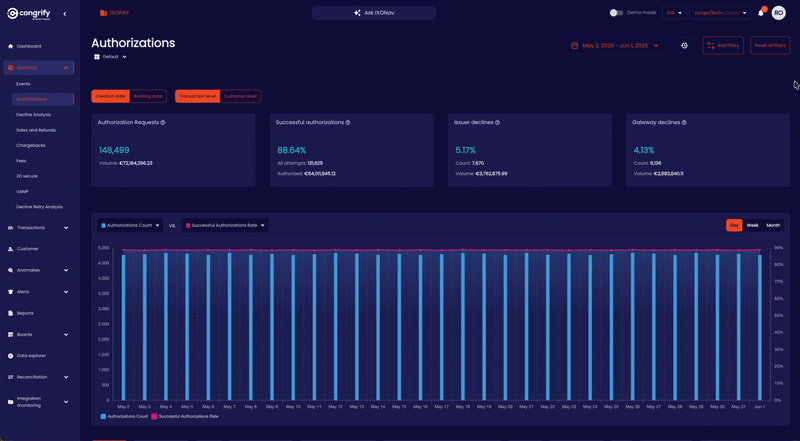
Track authorization requests, approval rates, and failed sales
Separate issuer declines from gateway or technical failures
Analyze trends by date type, customer level, transaction level, and time period

Understand gross revenue, net revenue, and refund impact.
Monitor sales performance and refund behavior across your payment ecosystem to spot revenue trends, customer behavior, and operational issues.
Compare gross sales, net sales, transaction counts, and average order value
Track refund volume, refund rates, and refund value
Slice performance by country, BIN, payment method, currency, issuer, gateway, and more

Expose payment cost drivers and protect processing margins.
Get visibility into the fee components that affect profitability across processors, acquirers, schemes, and transaction types.
Break down interchange, scheme, acquirer, gateway, conversion, and chargeback fees
Monitor total fees as a percentage of gross and net sales
Identify cost spikes by settlement currency, MID, BIN type, qualification code, and Durbin status
Learn more about fees and cost intelligence.

Reduce risk exposure while protecting conversion.
Track dispute, fraud, authentication, and network compliance metrics in one place to help prevent penalties and recover disputed revenue.
Monitor chargeback events, first and second chargebacks, and win rates
Analyze 3D Secure performance, challenges, exemptions, and authentication success
Track VAMP ratio, fraud rate, and network-specific chargeback indicators

Recover failed revenue and reduce involuntary churn.
Analyze retry chains and customer-level payment behavior to understand which retries recover revenue—and where billing logic needs improvement.
Track retry chains from first failure to recovery or abandonment
Compare successful first attempts, recovered retries, and failed retry chains
Measure time to recovery and analyze behavior by PSP customer ID or unified customer ID

“IXOPAY gave us much clearer visibility into what was driving our payment costs across PSPs, and cut a lot of the manual work it used to take to reconcile that data.”